Chart recommendations, flexible chart filtering & Microsoft sign-in (plus SSO support)
🤖 Smart chart recommendations
Get ready to accelerate your data visualizations with chart recommendations.
Next time you create a chart block, you’ll have the option to click on the Explore button, which will bring up a gallery of recommended charts based on your DataFrame.
The gallery includes the most commonly used chart types for data summarization. Simply select an option to use it as your own (Replace chart) or create a new chart based on it (Add new chart).
No more starting from scratch each time you need to build a chart. Quickly browse a wide range of data summaries, pick your starting point, and customize from there.
🖱 Interval selection on charts
Chart filtering just got a lot more flexible.
You can now select a range of data points directly with your mouse when you want to apply a filter to your chart.
Click and drag over an area on the chart to highlight your data. Then hit the Filter button to include or exclude the selected data or inspect it in a new DataFrame.
Zooming in on outlier data points is now easier — and more precise — than ever.
Read more on interactive filtering here →
🔐 Microsoft sign-in & enforcing SSO
You can now sign up and log in to Deepnote using your Microsoft 365 account.
And if you’re an admin on the Enterprise plan, you can enforce specific single sign-on methods — including Microsoft, Google, Okta, and more — for all members of a workspace.
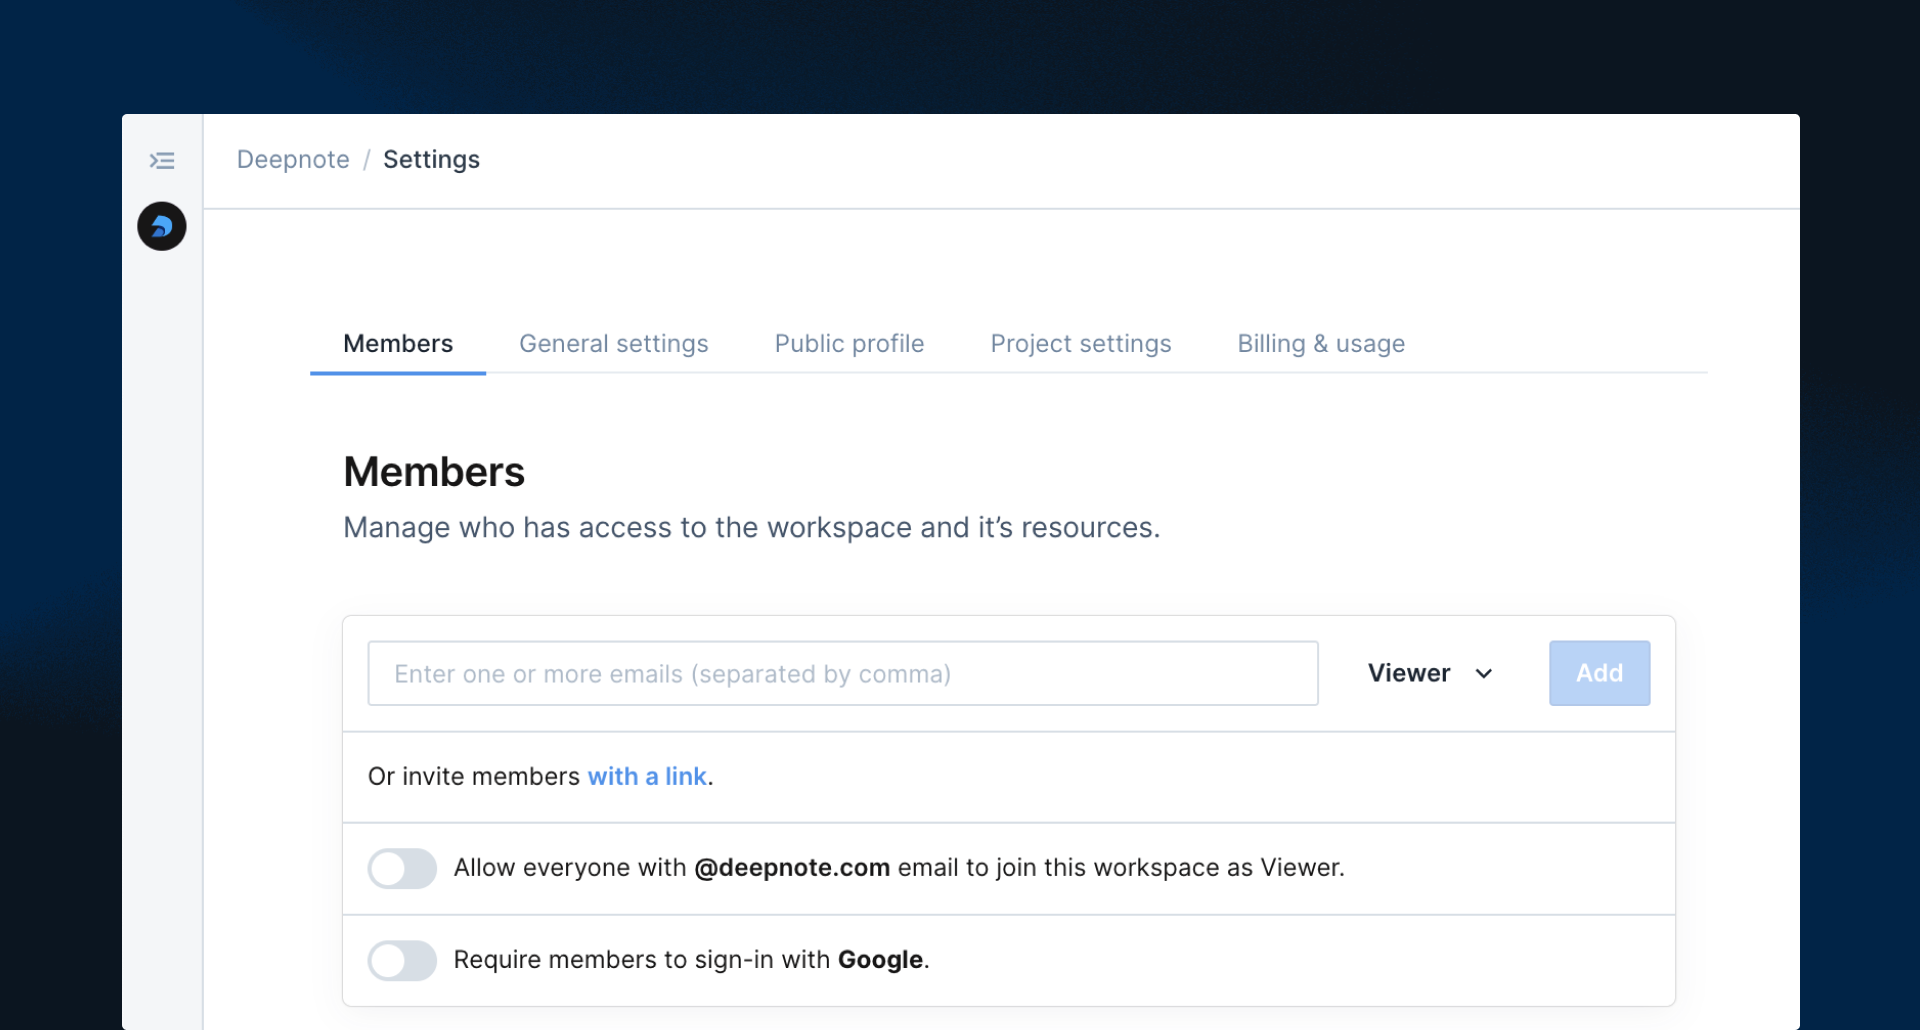
Authenticate users and keep workspaces secure with ease.